Customer Data Analytics in 2026: What to Track & How to Use It

You probably have way more customer data than you actually know what to do with. Between the ticket histories, chat transcripts, purchase records, and survey results scattered across three different platforms, it has basically turned into a digital hoarding situation. But despite sitting on all that gold, a surprising number of teams are still just winging it. They make pricing choices based on gut feelings, build schedules around rough guesses, and change the product just because one really loud customer won't stop complaining in the comments.
Customer data analytics is what bridges that gap. It turns the raw records of every customer interaction into actionable patterns: which channels generate the most complaints, which support issues precede cancellations, which customers are worth prioritizing, and which processes are silently eroding satisfaction before anyone raises a ticket.
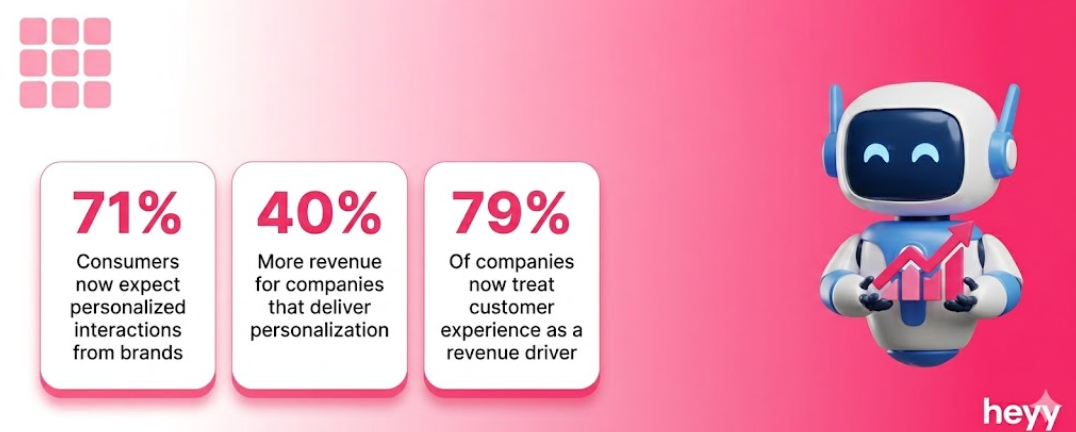
71% of consumers expect personalized interactions with brands, and companies that deliver personalization generate 40% more revenue than those who do not, according to McKinsey's research. You cannot personalize at scale without analytics. And you cannot build analytics without knowing which data to collect and which metrics to actually track.
This guide covers exactly that: the metrics that matter, the data that generates them, and what to do with the insight once you have it.
What Is Customer Data Analytics?
Customer data analytics is the practice of systematically collecting and analyzing information about your customers, from purchase history and support interactions to behavioral patterns and satisfaction scores, in order to make faster, more accurate business decisions.
It is not a dashboard. It is not a monthly report. It is the operational practice of turning customer signals into specific actions: adjusting staffing levels when queue times spike, identifying at-risk accounts before they churn, personalizing follow-up sequences based on what a customer has already told you, and measuring whether a product or service change actually improved the experience or only appeared to.
The businesses that do this well treat customer data as a continuous feedback loop, not a periodic reporting exercise.
Why Customer Data Analytics Matters More in 2026
Three structural shifts have made customer analytics a business-critical function rather than a nice-to-have.
Customer expectations for personalization have reached a threshold: 71% of consumers now expect companies to understand their individual needs, according to McKinsey, and 76% report frustration when that expectation is not met. A business without customer analytics cannot personalize at scale. It can only approximate.
Customer experience is now a recognized revenue driver: 79% of companies say leadership now views customer experience as a revenue driver, not a cost center, according to Nextiva's 2026 customer service statistics. CX-focused companies are approximately 60% more profitable than those that are not, per Salesmate's 2026 benchmarks. The analytics that measure CX are not overhead. They are the early warning system for revenue.
AI and chatbot interactions have added a new data layer: Every chatbot conversation is a structured data event: intent identified, question asked, resolution reached or escalated, time elapsed, sentiment expressed. 85% of customer interactions are projected to be handled without a human agent by the end of 2025, according to Gartner projections. That scale of interaction produces analytics data that was not available at this volume three years ago and that most businesses are not yet using.
The 3 Types of Customer Data Worth Collecting
Not all customer data is equally useful. The practical starting point is understanding what data you already have versus what you need to build systems to collect.
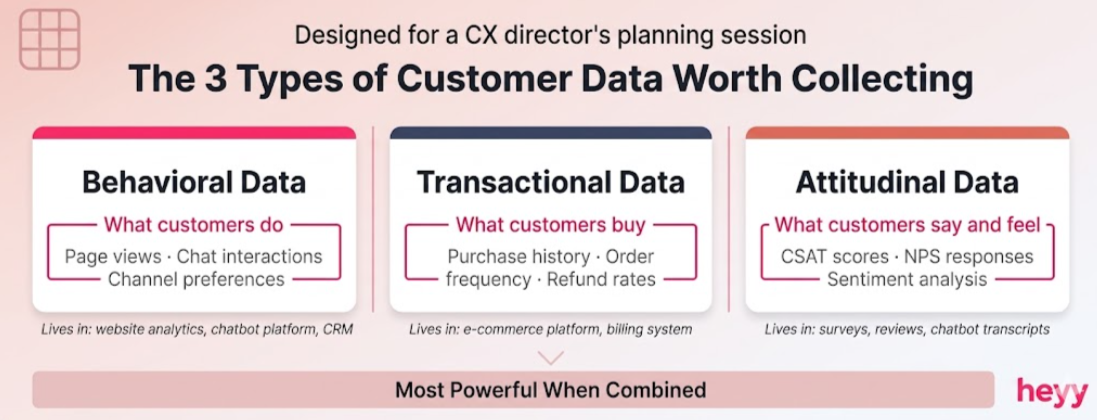
Behavioral data: What customers do: page views, chat interactions, purchase sequences, support ticket categories, channel preferences, response rates. This is the highest-volume data source and is available from your website analytics, CRM, and chatbot platform without additional collection infrastructure.
Transactional data: What customers buy, when, how often, and at what value. Purchase history, order frequency, average order value, subscription renewal timing, and refund rates. This lives in your e-commerce platform or billing system and is essential for CLV calculation and churn prediction.
Attitudinal data: What customers say and feel: satisfaction survey scores, NPS responses, support ticket sentiment, product reviews, and social media mentions. This is the qualitative layer that explains the behavioral and transactional patterns. It requires active collection (surveys, review prompts, sentiment analysis tools) rather than passive accumulation.
The most powerful analytics come from connecting all three. A customer whose behavior shows declining purchase frequency, whose transactional data shows shrinking order values, and whose attitudinal data shows a CSAT score below 3 is a churn candidate with three independent signals confirming the risk. Each signal alone is incomplete. Together they are a prediction.
The Key Metrics for Customer Data Analysis
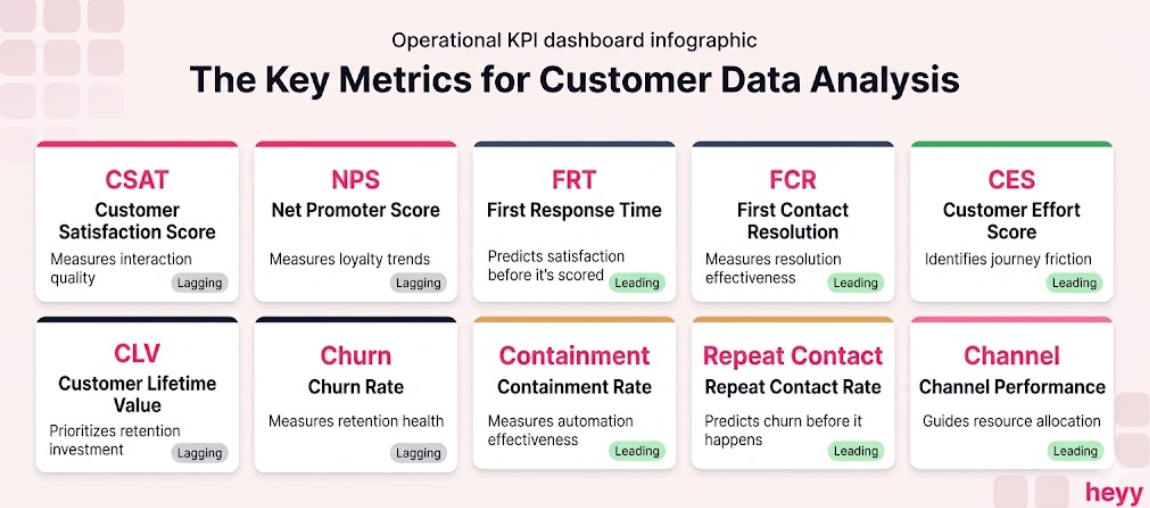
The following metrics are the ones with the most direct connection to revenue outcomes, customer retention, and operational efficiency. Not every business needs all of them immediately. The right starting point is the metric that addresses your biggest current problem.
1. Customer Satisfaction Score (CSAT)
What it measures: Customer satisfaction immediately after a specific interaction. Usually collected via a post-interaction survey: "How satisfied were you with this experience?" on a 1 to 5 or 1 to 10 scale.
The benchmark: A CSAT score above 80% is considered strong. Below 70% indicates systemic issues. Industry averages vary: e-commerce typically runs 73 to 80%, financial services 68 to 75%, technology 72 to 80%, according to Nextiva's 2026 customer service benchmarks.
What to do with it: Segment CSAT by channel, agent, and issue type. An aggregate CSAT score of 76% tells you almost nothing. A CSAT of 62% specifically on WhatsApp billing queries tells you exactly where to invest. First response time is the operational lever most directly correlated with CSAT, slow responses reliably produce low scores.
Its limitation: CSAT is a lagging indicator. It tells you what already happened, not what is about to happen. Use it alongside leading indicators.
2. Net Promoter Score (NPS)
What it measures: Customer loyalty and likelihood to recommend, on a 0 to 10 scale. Promoters (9 to 10) minus Detractors (0 to 6) gives your NPS, which runs from -100 to +100.
The benchmark: An NPS above 50 is excellent. Above 70 is world-class. Most B2B SaaS companies average 25 to 45. Most e-commerce businesses average 40 to 60, per Salesmate's 2026 customer service benchmark data.
What to do with it: Follow up with every Detractor (score 0 to 6) within 48 hours. The verbatim reason they gave for their score is more valuable than the score itself. It identifies the specific failure point — whether that is a product issue, a service failure, or a pricing concern — that your aggregate metrics cannot surface. 88% of customers are more likely to repurchase after a great service experience, according to HubSpot data cited in Nextiva's 2026 research, which means every Detractor converted to a Promoter is measurable revenue recovered.
Its limitation: Like CSAT, NPS is retrospective. It reflects experiences that have already occurred, not trends forming now.
3. First Response Time (FRT)
What it measures: The elapsed time between a customer's first contact and the first response from your team or AI system. Tracked by channel.
The benchmark: The average first response time across channels is 12 hours for email and under 2 minutes for live chat and messaging channels, according to Desk365's 2026 customer service statistics. Customer expectation is significantly faster than the average: most customers expect a response within an hour on chat and social channels, and within 4 hours on email.
What to do with it: Track FRT separately by channel and by time of day. After-hours FRT spikes (when no agents are available) are the clearest case for AI automation. A chatbot that responds in 1.1 seconds at 11pm produces a fundamentally different FRT distribution than a team working business hours only. Customer service queue management improvements consistently show FRT as the first metric that improves after automation implementation.
Its advantage over other metrics: FRT is a leading indicator. It predicts customer satisfaction before the satisfaction score is collected.
4. First Contact Resolution (FCR)
What it measures: The percentage of customer issues fully resolved on the first contact, without requiring a follow-up or repeat interaction from the same customer.
The benchmark: Industry FCR benchmarks sit between 70 and 80% for high-performing support operations, according to BlueTweak's 2026 customer support metrics analysis. Below 65% indicates systemic issues with either agent knowledge, escalation paths, or system integrations.
What to do with it: Identify the issue categories with the lowest FCR rates. These are the process failures, knowledge gaps, or system limitations that force customers to contact you twice for the same problem. Each of these categories is a priority for knowledge base improvement, agent training, or automation. AI chatbot ticket reduction directly improves FCR for the issue types that chatbots handle autonomously.
5. Customer Effort Score (CES)
What it measures: How easy it was for the customer to resolve their issue, typically collected post-interaction with: "How easy was it to resolve your issue today?" on a 1 to 7 scale.
The benchmark: CES is more predictive of customer loyalty than CSAT for transactional interactions. High-friction interactions (CES below 4) are among the strongest predictors of churn, according to CX Today's 2026 customer analytics benchmark report.
What to do with it: Use CES to identify the specific touchpoints in your customer journey that generate the most friction. A high-volume process with low CES scores (customers found it difficult) is the highest-priority candidate for redesign or automation. Self-service resolution through a well-trained chatbot consistently produces higher CES than human agent interactions for routine issues, because the absence of wait time removes the largest source of perceived effort.
6. Customer Lifetime Value (CLV)
What it measures: The total revenue a business can expect from a single customer account throughout the relationship. CLV = Average Purchase Value × Purchase Frequency × Customer Lifespan.
The benchmark: There is no universal CLV benchmark; the meaningful comparison is CLV versus Customer Acquisition Cost (CAC). A CLV:CAC ratio above 3:1 indicates a healthy unit economics model. Below 2:1 signals that acquisition costs are eroding lifetime value.
What to do with it: Segment your customer base by CLV and identify the behavioral and demographic characteristics of your highest-value customers. These are the customers your retention investment should protect most actively. They are also the profile your customer acquisition should target most aggressively. Businesses using CLV-based segmentation allocate support resources proportionally to revenue at risk, rather than treating every customer interaction with equal priority.
7. Churn Rate
What it measures: The percentage of customers who stop purchasing or cancel their subscription within a defined period. Churn Rate = Customers Lost ÷ Total Customers at Start of Period × 100.
The benchmark: Monthly churn above 5% indicates a serious retention problem for subscription businesses. Annual churn above 15% is considered high for B2B SaaS. E-commerce businesses track repeat purchase rate as the inverse of churn, per CX Today's 2026 customer analytics intelligence report.
What to do with it: Identify the behavioral signals that precede churn in your specific customer base. These vary by business type but commonly include: declining purchase frequency, decreasing session time, increasing support contact frequency, and declining NPS or CSAT scores. Build an early warning system that flags customers showing three or more of these signals simultaneously and triggers a proactive retention outreach.
8. Containment Rate
What it measures: The percentage of customer inquiries fully resolved by self-service or AI automation without requiring human agent involvement. Containment Rate = Self-Service Resolutions ÷ Total Interactions × 100.
The benchmark: Well-configured AI chatbot deployments achieve 60 to 80% containment rates for standard inquiry categories, according to BlueTweak's 2026 support metrics analysis. Below 40% indicates that the chatbot is deflecting rather than resolving, which typically generates low CES scores despite a technically high containment rate.
What to do with it: Distinguish between resolution containment (customer satisfied, no follow-up) and deflection containment (customer gives up or contacts again through a different channel). Only true resolution containment reduces cost and improves satisfaction. Track containment alongside post-interaction CSAT to ensure the two move in the same direction. If containment is rising while CSAT is falling, your chatbot is deflecting, not resolving.
9. Repeat Contact Rate
What it measures: The percentage of customers who contact support about the same issue more than once within a defined window (typically 7 to 30 days). This is one of the most operationally important metrics in 2026's customer analytics landscape, per CX Today's benchmark report.
The benchmark: Repeat contact rates above 20% are a leading indicator of both low FCR and high churn risk. Industry-leading operations maintain rates below 10%.
What to do with it: Every repeat contact is a failed first resolution. Segment repeat contacts by issue type, channel, and agent to identify whether the failure is in the process, the knowledge base, or the agent's resolution quality. Repeat contacts are expensive: they consume twice the support resources of a resolved first contact and damage customer satisfaction at a rate disproportionate to their frequency.
10. Channel Performance by Source
What it measures: Conversation volume, resolution rate, CSAT, FRT, and FCR segmented by channel: WhatsApp, Instagram DMs, Facebook Messenger, website chat, email, and phone.
What to do with it: Channel-level analytics reveal which channels your customers prefer, which channels your team handles most effectively, and where the performance gaps exist. A business with excellent website chat CSAT but poor WhatsApp CSAT has not trained its AI for the conversational register that WhatsApp requires. A business where Instagram DM volume is growing faster than resolution capacity has a staffing or automation decision to make before the gap creates a reputation problem. CRM chatbot integration allows channel-level data to flow into your customer record, making channel preference part of the contact's profile rather than an isolated metric.
The Benefits of Using Customer Analytics in Business
You Stop Reacting and Start Predicting
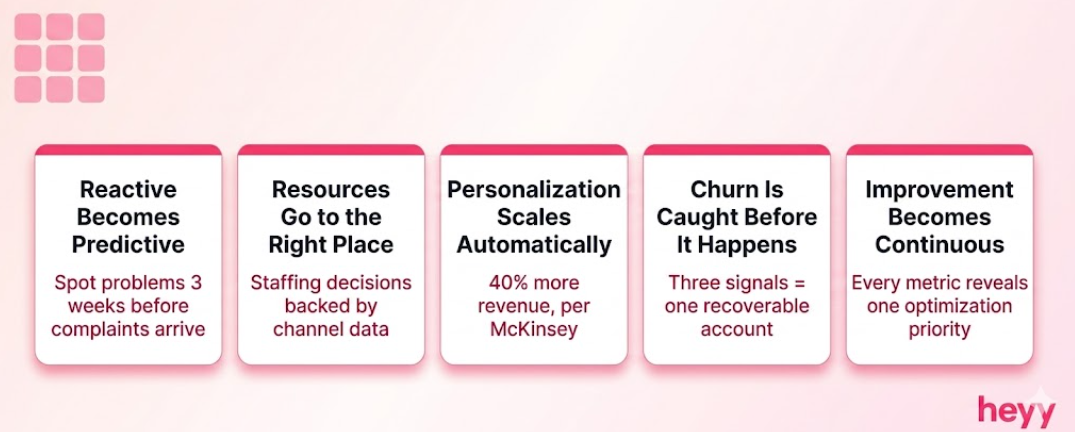
The benefits of using customer analytics in business begin with the shift from reactive to proactive. A business without analytics learns about a service problem when customers complain. A business with analytics detects the pattern three weeks earlier in repeat contact rate data, sentiment scores, and FCR degradation and fixes it before the complaints begin.
Resource Allocation Becomes Defensible
When you know which channels generate the most high-value contacts, which issue types consume the most agent time, and which customer segments produce the highest CLV, staffing, tooling, and investment decisions have a data foundation. The alternative is intuition, which is inconsistent and impossible to audit.
Personalization at Scale Becomes Possible
Companies that use customer analytics to deliver personalized experiences generate 40% more revenue than those that do not, per McKinsey's research. Personalization at scale requires knowing which customers prefer which channels, which issue types they historically contact about, and what their satisfaction history looks like. That knowledge is analytics output.
Churn Becomes Predictable Before It Happens
The benefits of using customer analytics in business are most financially significant in churn prevention. A customer showing three simultaneous risk signals (declining engagement, increasing support contact, falling satisfaction score) is a churn candidate with a recoverable account. Without analytics, that account churns quietly. With analytics, it triggers a retention action while there is still time to take one.
Operational Efficiency Improves Continuously
Every metric you track reveals an optimization opportunity. A declining FCR rate tells you to update the knowledge base. A rising repeat contact rate tells you to audit a specific resolution process. A containment rate that is rising faster than CSAT tells you to audit chatbot resolution quality. The analytics create the feedback loop that makes improvement continuous rather than periodic.
How to Turn Customer Data Into Action: The 4-Step Framework
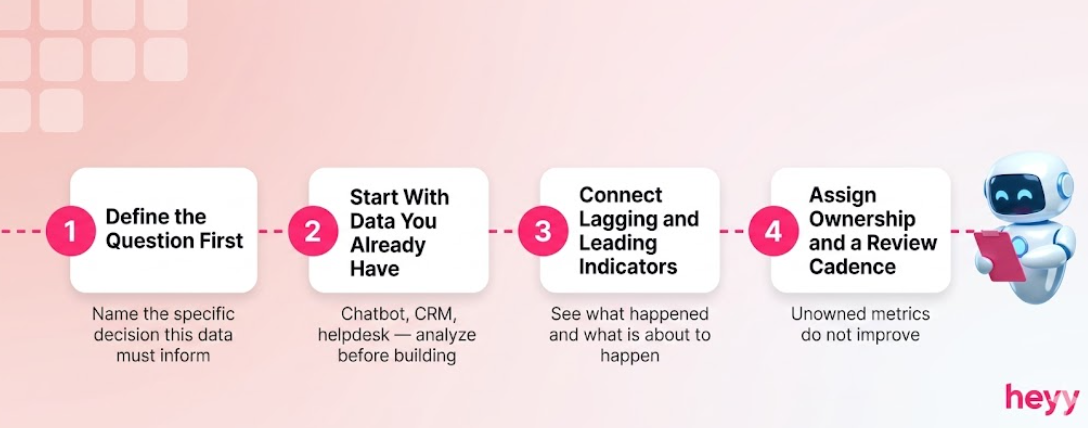
Step 1: Define the question first: Before collecting any data, name the decision you need to make. "Which support channel should we prioritize for AI automation in Q3?" is a question. "Improve customer satisfaction" is not. The question determines which metrics matter and which data sources to pull from.
Step 2: Start with behavioral data you already have: Most businesses underuse data they are already collecting. Your chatbot platform, CRM, and helpdesk have months of interaction data that has never been analyzed at the channel-issue-resolution level. The customer service metrics to track are already being generated by these systems, the gap is analysis, not collection. Start there before investing in new data collection infrastructure.
Step 3: Connect lagging and leading indicators: CSAT and NPS tell you what happened. Repeat contact rate, FRT, and sentiment trends tell you what is about to happen. Build your analytics view so both are visible together. A team that only monitors lagging indicators is always responding to history. A team that monitors both can intervene in the present.
Step 4: Assign ownership and a review cadence: Metrics that nobody owns do not improve. Assign a specific team member to each operational metric (FRT, FCR, containment rate) with a weekly review responsibility. Assign customer satisfaction and CLV metrics to a monthly cross-functional review. Data without an accountable owner produces reports, not action.
Customer data is only valuable when it is collected, structured, and connected to action. If your customer interactions across WhatsApp, Instagram, and your website are generating conversation data that is not flowing into an analytics view, you are operating without the signals that would tell you what to fix, where to invest, and which customers need proactive attention. Heyy connects every customer conversation across channels into one inbox with analytics that surface resolution rates, response times, and escalation patterns by channel. The data your conversations generate becomes the system that improves them. Start free and connect your first channel today.
Frequently Asked Questions
What is customer data analytics?
Customer data analytics is the systematic collection and analysis of information about customer behavior, transactions, and feedback to identify patterns and make better business decisions. It includes tracking metrics like satisfaction scores, purchase history, support resolution rates, and channel performance, and using those insights to personalize customer experiences, improve service quality, and reduce churn. In 2026, it increasingly includes data generated by AI chatbot interactions, which provide behavioral and sentiment data at a scale that was not available in earlier customer analytics models.
What are the most important key metrics for customer data analysis?
The key metrics for customer data analysis that have the strongest correlation to business outcomes are: Customer Satisfaction Score (CSAT) for interaction quality, Net Promoter Score (NPS) for loyalty trends, First Response Time (FRT) for speed performance, First Contact Resolution (FCR) for resolution effectiveness, Customer Effort Score (CES) for friction identification, Customer Lifetime Value (CLV) for revenue prioritization, Churn Rate for retention health, Containment Rate for automation effectiveness, Repeat Contact Rate as a leading churn indicator, and Channel Performance by Source for resource allocation decisions. Tracking all ten simultaneously is the goal. Starting with the two or three that address your most urgent business problem is the practical approach.
What customer service metrics to track first if I am starting from zero?
If you are starting from zero, the customer service metrics to track first are First Response Time and CSAT. FRT is available from your existing helpdesk or chat platform with no additional setup and is the strongest predictor of customer satisfaction before a satisfaction score is collected. CSAT requires a post-interaction survey but is straightforward to implement and immediately segments performance by channel, agent, and issue type. Once FRT and CSAT are running consistently, add FCR and Containment Rate to complete the operational picture.
What are the benefits of using customer analytics in business for a small team?
The benefits of using customer analytics in business are particularly significant for small teams because they create decision-making precision that compensates for limited headcount. A 3-person support team that knows which issue categories generate the most repeat contacts can invest their improvement time in exactly the right place rather than guessing. A small marketing team that knows their highest-CLV customer profile can allocate their acquisition budget to channels and audiences that produce those customers. Analytics scales the impact of every decision a small team makes.
How does AI chatbot data fit into customer analytics?
AI chatbot interactions generate structured behavioral data that most businesses are not yet using analytically. Every chatbot conversation records: the question asked (intent), whether it was resolved (containment), how long it took (FRT equivalent), how the customer responded (sentiment), and whether they escalated (FCR indicator). Aggregated across hundreds of conversations per day, this data reveals the most common customer intents, the gaps in your knowledge base, the resolution patterns that precede escalation, and the sentiment trends that predict satisfaction scores before they are collected. Integrating chatbot conversation data into your CRM creates a customer record that includes behavioral signals unavailable from traditional analytics sources.
How often should customer data analytics be reviewed?
Operational metrics (FRT, containment rate, repeat contact rate) should be reviewed weekly. Satisfaction metrics (CSAT, NPS, CES) should be reviewed monthly with trend analysis spanning the previous 90 days. Strategic metrics (CLV, churn rate, channel performance trends) should be reviewed quarterly with comparisons to the previous period and year-over-year. The review frequency should match the rate of change of the metric: operational metrics change daily and require weekly attention; strategic metrics change slowly and reward quarterly analysis.
More blog posts to read


Ready to Automate Support
Across Every Channel?
.svg)
.avif)