Chatbot Analytics in 2026: The Complete Guide to Measuring Performance & ROI

Here's something nobody talks about: I've seen businesses spend thousands on chatbot platforms, get excited about automation, launch the bot... and then have no idea if it's actually working.
They check "number of conversations" once a month, see a big number, and assume success. Meanwhile, the chatbot is frustrating customers, deflecting them to useless help articles, and causing more problems than it solves.
Last month, I audited a chatbot for an e-commerce company. They were proud that it handled "1,200 conversations per month." When I dug into the analytics:
- 68% of conversations ended with the user asking for a human agent
- Average conversation lasted 8+ minutes (customers struggling to get answers)
- Customer satisfaction score: 2.1 out of 5
- Actual resolution rate: 22%
Their chatbot was annoying people.
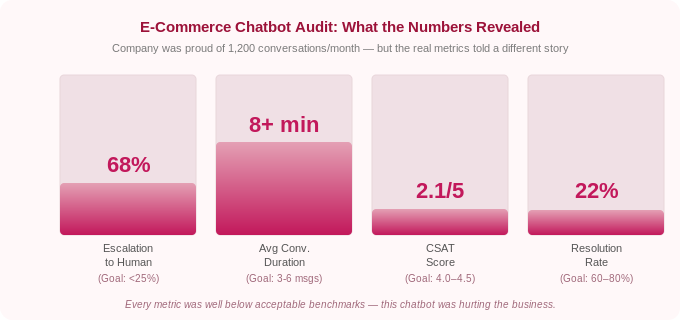
The problem? They were tracking vanity metrics (total conversations) instead of performance metrics (resolution rate, CSAT, deflection rate).
In 2026, chatbot analytics have evolved far beyond simple "number of messages." The best platforms now offer sophisticated tracking: intent recognition accuracy, sentiment analysis, revenue attribution, and AI confidence scores.
This guide breaks down the important chatbot analytics you need to track, how to interpret them, and how to use data to continuously improve your chatbot's performance.
Let's make sure your chatbot is actually working FOR your customers, not just for you…
Why Chatbot Analytics Matter (More Than You Think)
According to Master of Code Global, chatbots are expected to handle 95% of customer interactions by 2026. But a bad chatbot is worse than no chatbot at all.
Customers who have negative experiences with chatbots are:
- 3x more likely to abandon your brand (Gartner)
- Less likely to recommend your business
- More frustrated than if they'd waited for human support
On the flip side, well-optimized chatbots deliver massive value:
- 80-90% of routine inquiries resolved without human intervention (Gleap)
- $0.50 average cost per conversation vs $6+ for human agents (DemandSage)
- 23% increase in conversion rates for e-commerce (Glassix)
- 40%+ reduction in support costs (industry average)
The difference between a bad chatbot and a good one? Data-driven optimization.
You can't improve what you don't measure.
The Chatbot Analytics Framework: 4 Categories That Matter
Chatbot analytics fall into four categories:
1. Performance Metrics — Is the chatbot working?
2. User Experience Metrics — Are customers happy?
3. Business Impact Metrics — Is it driving results?
4. AI Quality Metrics — Is the AI accurate?
Let's break down each category.
1. Performance Metrics: Is Your Chatbot Working?
These metrics tell you if your chatbot is functional and effective.
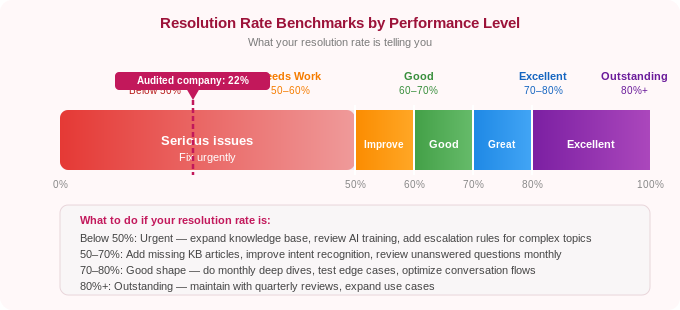
Resolution Rate (Goal: 60-80%)
Track this from day one. Resolution rate is your most important indicator of whether the chatbot is working.
Your resolution rate is the percentage of conversations the chatbot resolves without human intervention.
Why it matters: This is the single most important chatbot metric. If your chatbot isn't resolving conversations, it's not doing its job.
How to calculate:
Resolution Rate = (Conversations fully resolved by bot / Total conversations) × 100
Benchmark:
- 60-70%: Good performance
- 70-80%: Excellent performance
- 80%+: Outstanding (rare, usually only for very focused use cases)
- Below 50%: Your chatbot needs serious improvement
Example:
- Total conversations: 1,000
- Resolved by chatbot: 720
- Resolution rate: 72%. That’s good
How to improve:
- Add more training data for common unresolved questions
- Improve knowledge base coverage
- Refine AI prompts for better understanding
- Add fallback responses for edge cases
Deflection Rate (Goal: 60-75%)
Deflection rate quantifies your cost savings. This is the number to present to leadership when justifying chatbot investment.
Your deflection rate is the percentage of conversations handled by the chatbot that would have otherwise required a human agent.
Why it matters: Deflection rate shows how much work the chatbot is saving your team. High deflection = more time for your team to focus on complex issues.
How to calculate:
Deflection Rate = (Bot-resolved conversations / Total support volume) × 100
Benchmark:
- 60-70%: Solid automation
- 70-80%: Excellent automation
- Below 50%: Chatbot isn't deflecting enough volume
Containment Rate (Goal: 65-80%)
This is the percentage of conversations that stay within the chatbot without escalating to a human agent.
Why it matters: Containment measures how well the chatbot keeps conversations automated. Low containment means users are frequently asking for humans.
How to calculate:
Containment Rate = (Conversations completed by bot / Total bot conversations) × 100
Difference from Resolution Rate:
- Resolution Rate: Did the bot solve the problem?
- Containment Rate: Did the conversation stay with the bot or escalate?
A conversation can be "contained" (user didn't ask for a human) but not "resolved" (user left without an answer). Track both.
Average Response Time (Goal: <2 seconds)
This is literally how long it takes the chatbot to respond to user messages.
Why it matters: Speed is everything in customer expectations. AI chatbots should respond near-instantly.
Benchmark:
- <1 second: Excellent
- 1-3 seconds: Good
- 3-5 seconds: Acceptable
- >5 seconds: Too slow (feels broken to users)
If your chatbot takes more than 3 seconds to respond, something is wrong, likely complex API calls, slow knowledge base searches, or server issues.
Conversation Length (Goal: 3-6 messages)
This is the average number of messages exchanged in a conversation.
Why it matters: Shorter conversations usually mean the bot understood quickly and provided a good answer. Very long conversations often indicate confusion.
Benchmark:
- 2-4 messages: Excellent (quick resolution)
- 5-8 messages: Good (normal conversation flow)
- 8-12 messages: Acceptable (complex questions)
- 12+ messages: Problem (user is struggling or bot is confused)
How to interpret this:
If the average conversation length is 15+ messages, dig into transcripts. You'll likely find:
- Bot misunderstanding user intent
- Bot providing unhelpful answers
- User asking the same question repeatedly in different ways
Heyy shows all these metrics in a single dashboard.
Resolution rate, CSAT, deflection, unanswered questions, all in one place, with no manual setup required. Metrics start tracking automatically from your first conversation. Try Heyy today!
2. User Experience Metrics: Are Customers Happy?
Performance metrics tell you if the bot works. UX metrics tell you if users like it.
Customer Satisfaction Score (CSAT) (Goal: 4.0-4.5 out of 5)
CSAT gives you direct user feedback. Set up a post-conversation survey before you launch and track it weekly.
What it is: User rating after a chatbot conversation, typically "How satisfied were you with this interaction?"
Why it matters: Direct feedback from users on chatbot quality.
How to measure:
- Post-conversation survey: "How would you rate this interaction?" (1-5 stars)
- Or: "Did this resolve your issue?" (Yes/No)
Benchmark:
- 4.2-4.5+: Excellent
- 3.8-4.2: Good
- 3.5-3.8: Needs improvement
- <3.5: Poor (major issues)
Important: Only measure CSAT for resolved conversations. If the bot escalated to a human, don't count that in bot CSAT.
Net Promoter Score (NPS) (Goal: 30-50)
This measures how likely users are to recommend your chatbot (or service) based on their chatbot experience.
Why it matters: NPS correlates with long-term customer loyalty and brand perception.
How to measure: "How likely are you to recommend our chatbot to a friend?" (0-10 scale)
- Promoters: 9-10
- Passives: 7-8
- Detractors: 0-6
How to calculate:
NPS = % Promoters - % Detractors
Benchmark:
- 50+: Excellent
- 30-50: Good
- 10-30: Acceptable
- <10: Poor
Sentiment Analysis (Goal: 70%+ positive)
This is an AI-driven analysis of user sentiment during conversations (positive, neutral, negative).
Why it matters: It catches frustration before it becomes visible in CSAT scores. You can see when users are getting annoyed mid-conversation.
How to track:
Modern chatbot platforms (like Heyy.io, Intercom, Zendesk) include sentiment analysis that detects:
- Positive language: "Thanks!", "Perfect!", "That helps"
- Neutral language: Straightforward questions without emotion
- Negative language: "This isn't working", "I need a human", curse words
Benchmark:
- 70%+ positive sentiment: Excellent
- 50-70% positive: Good
- <50% positive: Problems (users are frustrated)
How to use it:
If you see a spike in negative sentiment, dig into those conversations. Common issues:
- Chatbot misunderstands intent repeatedly
- Bot gives irrelevant answers
- Technical errors (bot breaks, doesn't load, etc.)
Goal Completion Rate (Goal: 75%+)
It’s a percentage of users who complete their intended goal (e.g., found answer, made purchase, booked appointment).
Why it matters: Measures actual outcomes, not just whether the bot responded.
Example goals:
- Customer finds tracking information for their order
- User books an appointment
- Shopper adds recommended product to cart
- Visitor completes lead form
How to track: Define specific goals in your chatbot analytics platform and track completion.
Benchmark:
- 75%+: Excellent
- 60-75%: Good
- <60%: Users aren't achieving goals (major issue)
3. Business Impact Metrics: Is It Driving Results?
These metrics connect chatbot performance to revenue, cost savings, and business outcomes.
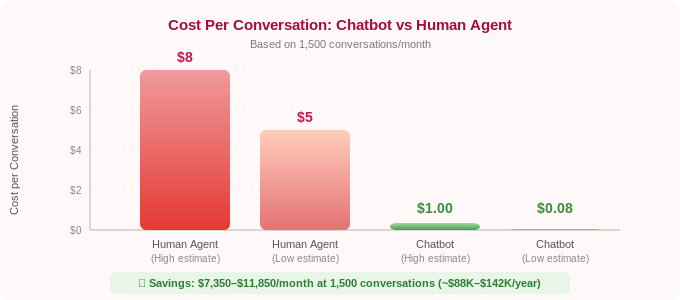
Cost Per Conversation (Goal: <$1)
What it is: Average cost of each chatbot conversation.
Why it matters: Compares chatbot efficiency to human agents. Human support costs $5-8 per conversation; chatbots should be $0.20-1.00.
How to calculate:
Cost Per Conversation = (Total chatbot costs / Total conversations)
Example:
- Monthly chatbot cost: $149 (Heyy.io Pro plan)
- Total conversations: 1,800
- Cost per conversation: $0.08
For comparison:
- Human agent: $5-8 per conversation (salary, benefits, overhead)
- Chatbot: $0.10-1.00 per conversation
If your chatbot handles 1,500 conversations/month at $0.10 each, that's roughly $150/month. Human agents would cost $7,500-12,000/month for the same volume.
Savings: $7,350-11,850/month (or $88,200-142,200/year).
Cost Savings (Calculate Monthly)
It’s the total money saved by deflecting conversations from human agents.
How to calculate:
Cost Savings = (Deflected conversations × Average cost per human conversation)
Example:
- Deflected conversations: 1,200/month
- Average human agent cost: $7 per conversation
- Monthly savings: $8,400
- Annual savings: $100,800
This is your ROI metric. Present this to leadership when justifying a chatbot investment.
Revenue Attribution (Track If Selling Products/Services)
This is simply the revenue directly generated from chatbot conversations.
Why it matters: Shows the chatbot is a revenue driver, not just a random tool.
How to track:
Modern chatbot platforms can track:
- Product recommendations that lead to purchases
- Upsells during support conversations ("Need accessories for that?")
- Lead qualification that converts to sales
- Appointments booked that become paying customers
Example:
An e-commerce chatbot recommends products during conversations. 340 users purchased recommended items in one month, generating $28,000 in revenue.
Even if the chatbot costs $300/month, the ROI is 93x.
The strategic framing matters here: revenue attribution transforms the chatbot from a cost-reduction tool into a growth asset. This distinction is significant for leadership conversations. A cost-reduction frame puts the chatbot in competition with budget cuts. A revenue-generation frame puts it in a different category entirely, the same category as your paid media and sales team.
To build the attribution case properly, you need three things connected: your chatbot platform (which tracks the conversation), your product catalog or appointment system (which records the purchase or booking), and a UTM or session ID that links the two. Most modern platforms, including Heyy, handle this connection natively. If you're running on Shopify or WooCommerce, the integration automatically tracks which chatbot conversations resulted in completed orders. Review this monthly and separate it into three buckets: direct revenue (chatbot recommended a product and the user purchased in the same session), assisted revenue (chatbot answered a question and the user purchased within 24 hours), and recovered revenue (chatbot caught an abandoning user and recovered the cart).
Lead Conversion Rate (Goal: 15-25% for qualified leads)
This is the percentage of chatbot conversations that convert to qualified leads or sales.
Why it matters: Measures chatbot effectiveness in sales and marketing.
How to calculate:
Lead Conversion Rate = (Leads generated / Total conversations) × 100
Example:
- Total chatbot conversations: 2,000
- Qualified leads captured: 420
- Lead conversion rate: 21%
Time Saved (Hours Per Month)
This is the total hours saved by automating conversations.
How to calculate:
Time Saved = (Deflected conversations × Average time per human conversation)
Example:
- Deflected conversations: 1,500/month
- Average human conversation time: 5 minutes
- Time saved: 7,500 minutes = 125 hours/month
That's the equivalent of 3 full-time employees worth of work.
4. AI Quality Metrics: Is the AI Accurate?
These metrics measure how well the AI understands and responds.
Intent Recognition Accuracy (Goal: 85%+)
What it is: How often the chatbot correctly identifies what the user is asking for.
Why it matters: If the bot misunderstands intent, it gives wrong answers—frustrating users.
Example:
User asks: "Can I return this if it doesn't fit?"
- Correct intent: Return policy question
- Incorrect intent: Sizing question, shipping question
Benchmark:
- 90%+: Excellent
- 85-90%: Good
- 80-85%: Needs improvement
- <80%: Poor (major training needed)
Knowledge Base Coverage (Goal: 80%+)
What it is: Percentage of user questions your knowledge base can answer.
Why it matters: Gaps in knowledge base = unanswered questions.
How to track:
Good chatbot analytics show "unanswered questions", topics where the bot said "I don't know."
Review these monthly and add missing information to your knowledge base.
Example:
Out of 2,000 conversations, the bot couldn't answer 340 questions (17% gap).
Review the 340 unanswered questions and identify themes:
- 120 questions about international shipping (add policy to knowledge base)
- 85 questions about product compatibility (add compatibility guide)
- 60 questions about warranty (add warranty policy)
- 75 misc one-off questions (acceptable)
After adding the missing documentation, coverage improves from 83% to 94%.
Confidence Score (Goal: 80%+ average)
What it is: The AI's confidence level in its own response (typically 0-100%).
Why it matters: Low confidence often means the AI is guessing. High confidence usually means accurate responses.
How to use it:
Set escalation rules:
• Confidence >85%: Bot answers automatically
• Confidence 60–85%: Bot provides answer but flags for agent review, add an internal note visible to your team
• Confidence <60%: Bot escalates to human immediately with full conversation context
This prevents the bot from confidently giving wrong answers. But there is a less obvious use too: tracking how your average confidence score changes over time is a direct measure of knowledge base health. When you add well-structured documentation, average confidence goes up. When your product changes and your docs haven't been updated, average confidence drops, often before customers start complaining. Use confidence score as an early warning system for knowledge base drift.
One practical note: confidence score is most valuable on queries you have seen before. For genuinely novel queries, questions the model has never received, the confidence signal is less reliable. This is why pairing confidence thresholds with a missed-questions report is more effective than using either in isolation.
Hallucination Rate (Goal: <5%)
What it is: Percentage of responses where the AI "makes up" information not in your knowledge base.
Why it matters: AI hallucinations damage trust. Users expect accurate answers.
How to track:
Review random samples of conversations monthly. Flag any responses where the AI provided information that doesn't exist in your training data.
Example:
Review 100 random conversations. Find 3 where the AI hallucinated facts.
Hallucination rate: 3% Acceptable
If the hallucination rate is >10%, your AI needs better grounding in knowledge base sources or more explicit prompts like "Only answer based on provided documentation."
There are three main causes of hallucination in customer service chatbots, and each has a different fix:
1. Knowledge base gaps: the model cannot find a relevant source so it generates a plausible-sounding answer from training data instead. Fix: increase knowledge base coverage and review the missed-questions report monthly.
2. Ambiguous system prompt: the model is not explicitly told to say 'I don't know' when confidence is low, so it fills the gap with a confident-sounding guess. Fix: add an explicit instruction to your system prompt: 'If you cannot find the answer in the provided documentation, say that you don't have that information and offer to connect the user with a human agent.'
3. Outdated training data: the model answers from its general training data rather than your current documentation, especially for questions about pricing, policies, or product availability. Fix: ensure RAG retrieval is active and that your knowledge base reflects current information. A knowledge base last updated six months ago is a hallucination risk.
Hallucination rate should be your primary quality metric for compliance-sensitive industries (healthcare, finance, legal). In these contexts, a 3% hallucination rate is not 'acceptable', it is a liability. Set a stricter threshold (under 1%) and conduct weekly rather than monthly random sample reviews.
Essential Chatbot Analytics Dashboard: What to Track Weekly
Don't try to track everything. Focus on these main metrics:
Performance:
- Resolution Rate
- Deflection Rate
- Average Response Time
User Experience:
- CSAT Score
- Sentiment Analysis (% positive)
- Goal Completion Rate
Business Impact:
- Cost Savings
- Lead Conversion Rate (if applicable)
- Revenue Attribution (if applicable)
AI Quality:
- Intent Recognition Accuracy
- Unanswered Questions (knowledge base gaps)
Weekly Review Process:
- Check performance metrics (is the bot working?)
- Review low CSAT conversations (why are users unhappy?)
- Identify unanswered questions (what's missing from the knowledge base?)
- Calculate cost savings (show ROI to leadership)
Monthly deep dive: analyze trends, compare to previous months, set improvement goals.
How to Actually Improve Your Chatbot Using Analytics
Data without action is useless. Here's how to use analytics for continuous improvement:
Step 1: Identify the Biggest Problem
Look at your metrics. What's the worst?
- Low resolution rate (<50%)? → Knowledge base gaps
- Low CSAT (<3.5)? → Poor responses or misunderstanding intent
- High conversation length (12+ messages)? → Bot is confusing users
- Low deflection (<50%)? → Too many escalations
Fix the worst metric first.
Step 2: Dig Into Conversation Transcripts
Numbers tell you what is broken. Transcripts tell you why.
Read 20-30 conversations from your problem area. Look for patterns:
- Same questions repeatedly unanswered?
- Bot misunderstanding specific phrases?
- Users asking for humans after specific types of questions?
Step 3: Make Targeted Improvements
Based on patterns, update:
- Knowledge base: Add missing information
- AI training: Provide examples of misunderstood phrases
- Escalation rules: Route specific topics to humans faster
- Conversation flows: Simplify confusing paths
Step 4: Measure Impact
After changes, track metrics for 1-2 weeks. Did the needle move?
Example:
Problem: Resolution rate = 48%
Action: Added 15 new knowledge base articles covering top unanswered questions
Result (2 weeks later): Resolution rate = 67%
Success! Continue iterating.
Chatbot Analytics Benchmarks by Industry (2026)
Here are typical benchmarks based on industry:
Why the differences?
- E-commerce & retail: Simpler questions (order tracking, returns) = higher resolution
- Healthcare & finance: Complex, regulated queries = lower resolution (more human handoff needed)
- SaaS/tech: Varies widely based on product complexity
Use these as directional benchmarks, not absolute targets. Your specific business may differ.
Chatbot Analytics Audit Checklist
Use this checklist to audit your chatbot right now. If you can't answer 'yes' to a question, that metric or process is a gap to fix. Go through this monthly.
Performance Health
☐ Is your resolution rate above 60%? (If not: knowledge base gaps are the most likely cause: review unanswered questions and add content.)
☐ Are you tracking deflection rate separately from total conversation count? (Volume alone is a vanity metric — deflection rate is what shows cost impact.)
☐ Is your average response time under 3 seconds across all channels? (Slow responses on WhatsApp or Instagram are often a platform or API configuration issue, not the LLM.)
User Experience
☐ Do you have a post-conversation CSAT survey running? (If not: set one up immediately. Without it you are flying blind on customer satisfaction.)
☐ Is your CSAT score above 4.0/5? (If not: read the 20 lowest-rated conversations from the past week, the pattern is almost always in the first 3 messages.)
☐ Is your sentiment analysis showing 70%+ positive conversations? (If below 50%: something is frustrating users, check for repeated misunderstood intents or broken flows.)
AI Quality
☐ Do you have a 'missed questions' or 'unanswered queries' report set up? (This is the most actionable report in your analytics, review it weekly and add content to fill gaps.)
☐ Is your intent recognition accuracy above 80%? (If not: add more training examples for the misunderstood query types, focus on the 5 highest-volume misidentified intents.)
☐ Have you reviewed a random sample of 30 conversations in the last 30 days? (Dashboard metrics tell you what is broken. Transcripts tell you why.)
Business Impact
☐ Do you know your monthly cost per conversation? (Divide total chatbot cost by total conversations, this is your core ROI metric for leadership reporting.)
Frequently Asked Questions (FAQs)
Q: What's the most important chatbot metric to track?
A: Resolution rate. It measures whether your chatbot is actually solving customer problems. A chatbot with high conversation volume but low resolution rate is just wasting people's time. Aim for 60-80% resolution rate as your North Star metric.
Q: How often should I check chatbot analytics?
A: Weekly for core metrics (resolution rate, CSAT, deflection), monthly for deep dives and trends. Set calendar reminders. Don't check once and forget.
Q: What's a good CSAT score for a chatbot?
A: 4.0-4.5 out of 5 is good. For context, human customer service averages 4.2-4.4. If your chatbot scores above 4.0, it's performing well. Below 3.5 indicates serious issues that need immediate attention. Above 4.5 is exceptional and rare.
Q: How do I calculate ROI on my chatbot?
A: Calculate monthly cost savings: (Deflected conversations × Cost per human conversation) - Chatbot platform cost = Net savings.
Example: 1,500 deflected conversations × $7 per human conversation = $10,500 saved. Chatbot costs $150/month. Net savings: $10,350/month or $124,200/year. That's your ROI.
Q: What if my resolution rate is low (<50%)?
A: Low resolution rate usually means knowledge base gaps. Review unanswered questions from your analytics, identify common themes, and add missing documentation. Also check intent recognition accuracy, if the bot misunderstands what users are asking, it can't provide good answers. Focus on these two areas first.
Q: Should I track different metrics for different channels (website vs WhatsApp)?
A: Yes. Conversation patterns differ by channel. Website chat users often need quick answers to pre-purchase questions. WhatsApp users might be checking order status or asking complex support questions. Track metrics separately by channel to identify channel-specific optimization opportunities.
Q: What is a good chatbot resolution rate?
A: A resolution rate of 60–70% is considered good performance for a well-configured chatbot. 70–80% is excellent. Above 80% is rare and typically only achievable for very narrow, focused use cases with highly structured queries, like a chatbot that only handles order tracking or appointment booking. If you are below 50%, the most common cause is knowledge base gaps: the bot is being asked questions it doesn't have the content to answer. Review your unanswered questions report and fill the most frequent gaps first.
Q: How do I improve my chatbot's CSAT score?
A: The most reliable way to improve CSAT is to read the lowest-scoring conversations. Aggregate analytics show you the score; transcripts show you why it is low. Common patterns: the bot misunderstands the user's intent in the first message, the bot gives a technically correct but unhelpful answer, or the user asks for a human and the escalation process is slow or confusing. Fix the most common pattern first. CSAT typically improves within two weeks of targeted knowledge base or prompt changes. Also ensure you are only measuring CSAT on conversations the bot handled, including escalated conversations in bot CSAT distorts the score.
Q: What's the difference between deflection rate and resolution rate?
A: Deflection rate measures how many conversations were handled by the bot instead of reaching a human agent. Resolution rate measures how many conversations were fully resolved, the customer's problem was actually solved. A chatbot can have a high deflection rate (most conversations stay with the bot) but a low resolution rate (users leave without getting an answer, even though they never asked for a human). This is the most common form of chatbot failure — the bot 'deflects' the customer from a human agent without actually helping them. Track both. A healthy chatbot has both high deflection and high resolution; a failing chatbot often has high deflection and low resolution or low CSAT.
Q: How do I measure chatbot ROI?
A: The most straightforward ROI calculation: (Monthly deflected conversations × Average cost per human conversation) minus (Monthly chatbot platform cost) = Net monthly savings. Use $6–8 as the average cost per human conversation if you don't have your own figure (this is the widely cited industry range including salary, benefits, and overhead). Multiply monthly savings by 12 for an annual ROI figure. If your chatbot also generates revenue (cart recovery, product recommendations, lead qualification), add that revenue to the calculation as a second column. Present both the cost-saving ROI and the revenue-generating ROI separately, they resonate with different stakeholders. Finance cares about cost reduction. Sales and marketing leadership care about revenue impact.
Turn Data Into Better Chatbots
Your chatbot will never be perfect on day one. It’s a product. Treat it like one. Measure, iterate, improve.
Most businesses see 20-40% improvement in resolution rate within the first 3 months just from regular analytics review and optimization.
That's the difference between a chatbot that frustrates customers and one that delights them.
So start tracking the metrics that matter with Heyy.io today.
More chatbot optimization resources:
More blog posts to read


Ready to Automate Support
Across Every Channel?
.svg)
.avif)